Variable Star Astronomy

Most stars in the sky shine with constant brightness night after night. However, some do not—they brighten, fade, pulsate, or explode, thereby changing their luminosity. We call them variable stars, and monitoring them is a field where even today, an amateur with a telescope can contribute to real science.

uranometria cetus 1603 | Variable Star Astronomy
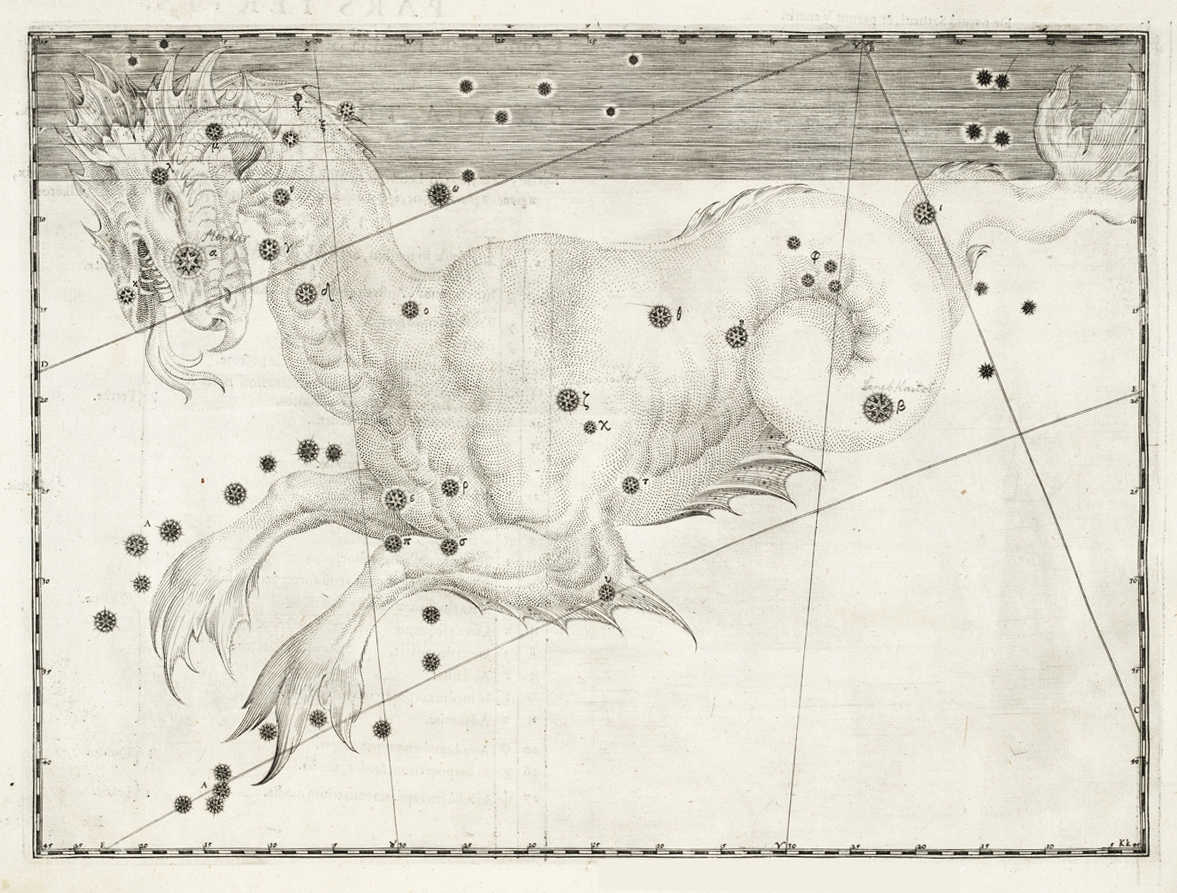
The constellation Cetus (the Whale) in Johann Bayer's 1603 star atlas, Uranometria. The star Mira is the one marked "o"; Bayer included it in the atlas only seven years after David Fabricius first noticed its changes in brightness. It later earned the name Mira, meaning "Wonderful," for good reason: at its maximum, it is visible to the naked eye, while at its minimum, it disappears even from smaller telescopes. ... Credit: Johann Bayer, Uranometria (1603), digitized by ETH Zürich / e-rara. Public domain.

History – From the Miraculous Star to Space Telescopes

People noticed changes in the brightness of certain stars as far back as antiquity. However, systematic research did not begin until the 16th century—giving rise to an entirely new branch of astronomy.

The first documented variable star was Mira (Omicron Ceti) in the constellation Cetus. The Dutch astronomer David Fabricius noticed its changes in 1596. Mira changes its brightness in a cycle lasting approximately 332 days—and it earned its name, Latin for “Wonderful,” rightfully: at its maximum, it is easily found with the naked eye, while at its minimum, it disappears even from smaller telescopes.

In 1669, Geminiano Montanari drew attention to the regular drops in brightness of the star Algol (Beta Persei). A century later, John Goodricke and Edward Pigott studied eclipsing and pulsating variable stars—and it was Goodricke who correctly explained Algol’s variability: two stars orbiting each other mutually eclipse one another from our perspective.

In the 19th century, interest in variable stars surged, and new types were added—among them, Cepheids. These proved to be the key to measuring the universe: Henrietta Leavitt discovered the relationship between their period and luminosity, thanks to which Cepheids became “standard candles” for determining cosmic distances.

The twentieth century belonged to organized observers. The American AAVSO was founded in 1911, and in 1924, the Variable Star Section of the Czech Astronomical Society was established—the direct predecessor of today’s SPHE ČAS. Photography and later digital detectors opened variable star astronomy to thousands of observers. And today? Thanks to space telescopes like Kepler or TESS, we know of over a million variable stars, and the same methods used to study them are also revealing exoplanet transits.
zakrytove dvojhvezdy krivky ea eb ew v2 | Variable Star Astronomy
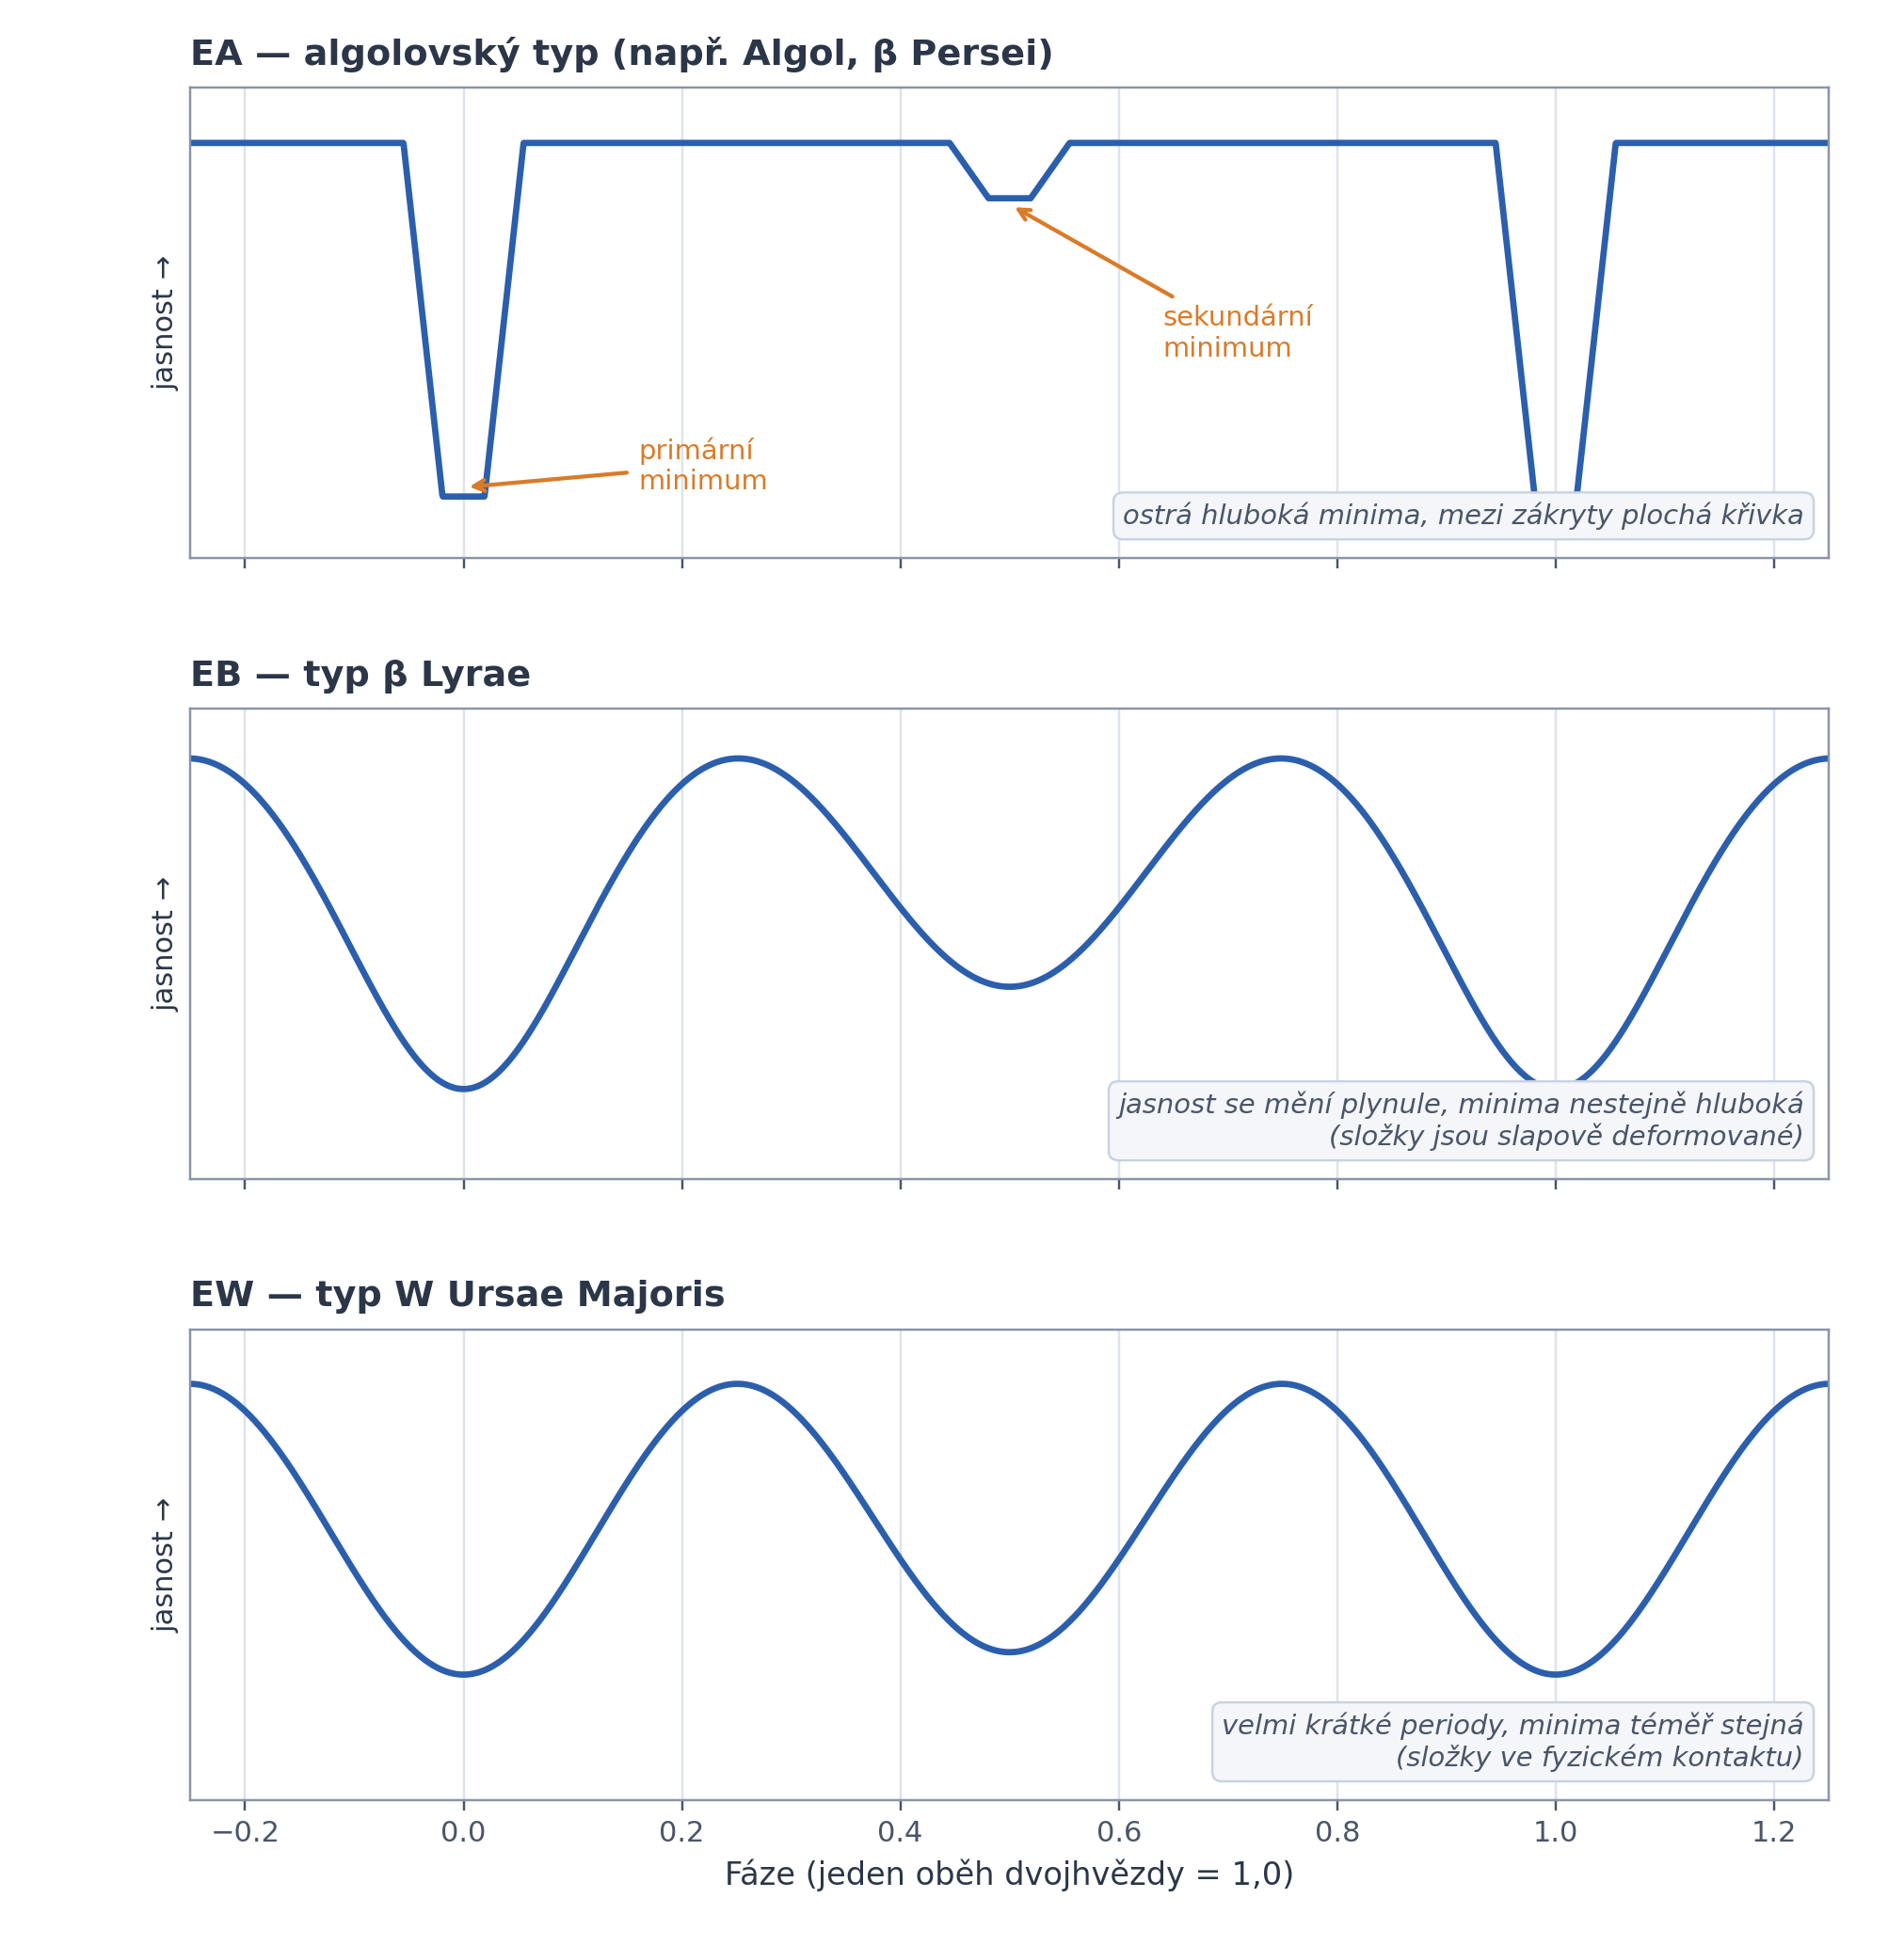
Three basic types of light curves for eclipsing binaries. The shape of the curve reveals how close the two stars are to each other—from the detached components of Algol-type systems to the contact stars of the W UMa type. Schematic representation. Credit: SPHE ČAS, 2026.

Classification – Stars in Eclipse

Eclipsing variable stars do not change their brightness on their own. They are typically binary star systems in which one component regularly eclipses the other—and we on Earth measure periodic drops in brightness, which are beautifully plotted in a light curve. And it does not have to stop at pairs: multiple eclipsing systems exist, such as quadruple stars—and the members of our section have had great success in their discovery and research.

We distinguish three important subtypes based on the shape of the curve. Algol systems (EA) have distinct, sharp drops in brightness and a flat light curve between eclipses. Beta Lyrae (EB) systems change brightness continuously, without a clear end to the eclipse—the components are so close that they are tidally distorted. Finally, W Ursae Majoris (EW) stars have very short periods and both components are in physical contact—sharing a common atmosphere.

Why study eclipsing binaries? Because they are natural laboratories: their light curves allow us to determine the masses, dimensions, and evolutionary states of both components—quantities that are very difficult to measure for isolated stars.

Furthermore, the times of minima in eclipsing binaries hide another treasure: when monitored long enough, they reveal what you cannot see in the system. How this works is shown by the O-C diagram method, which we cover in a separate chapter below.

cefeida svetelna krivka | Variable Star Astronomy
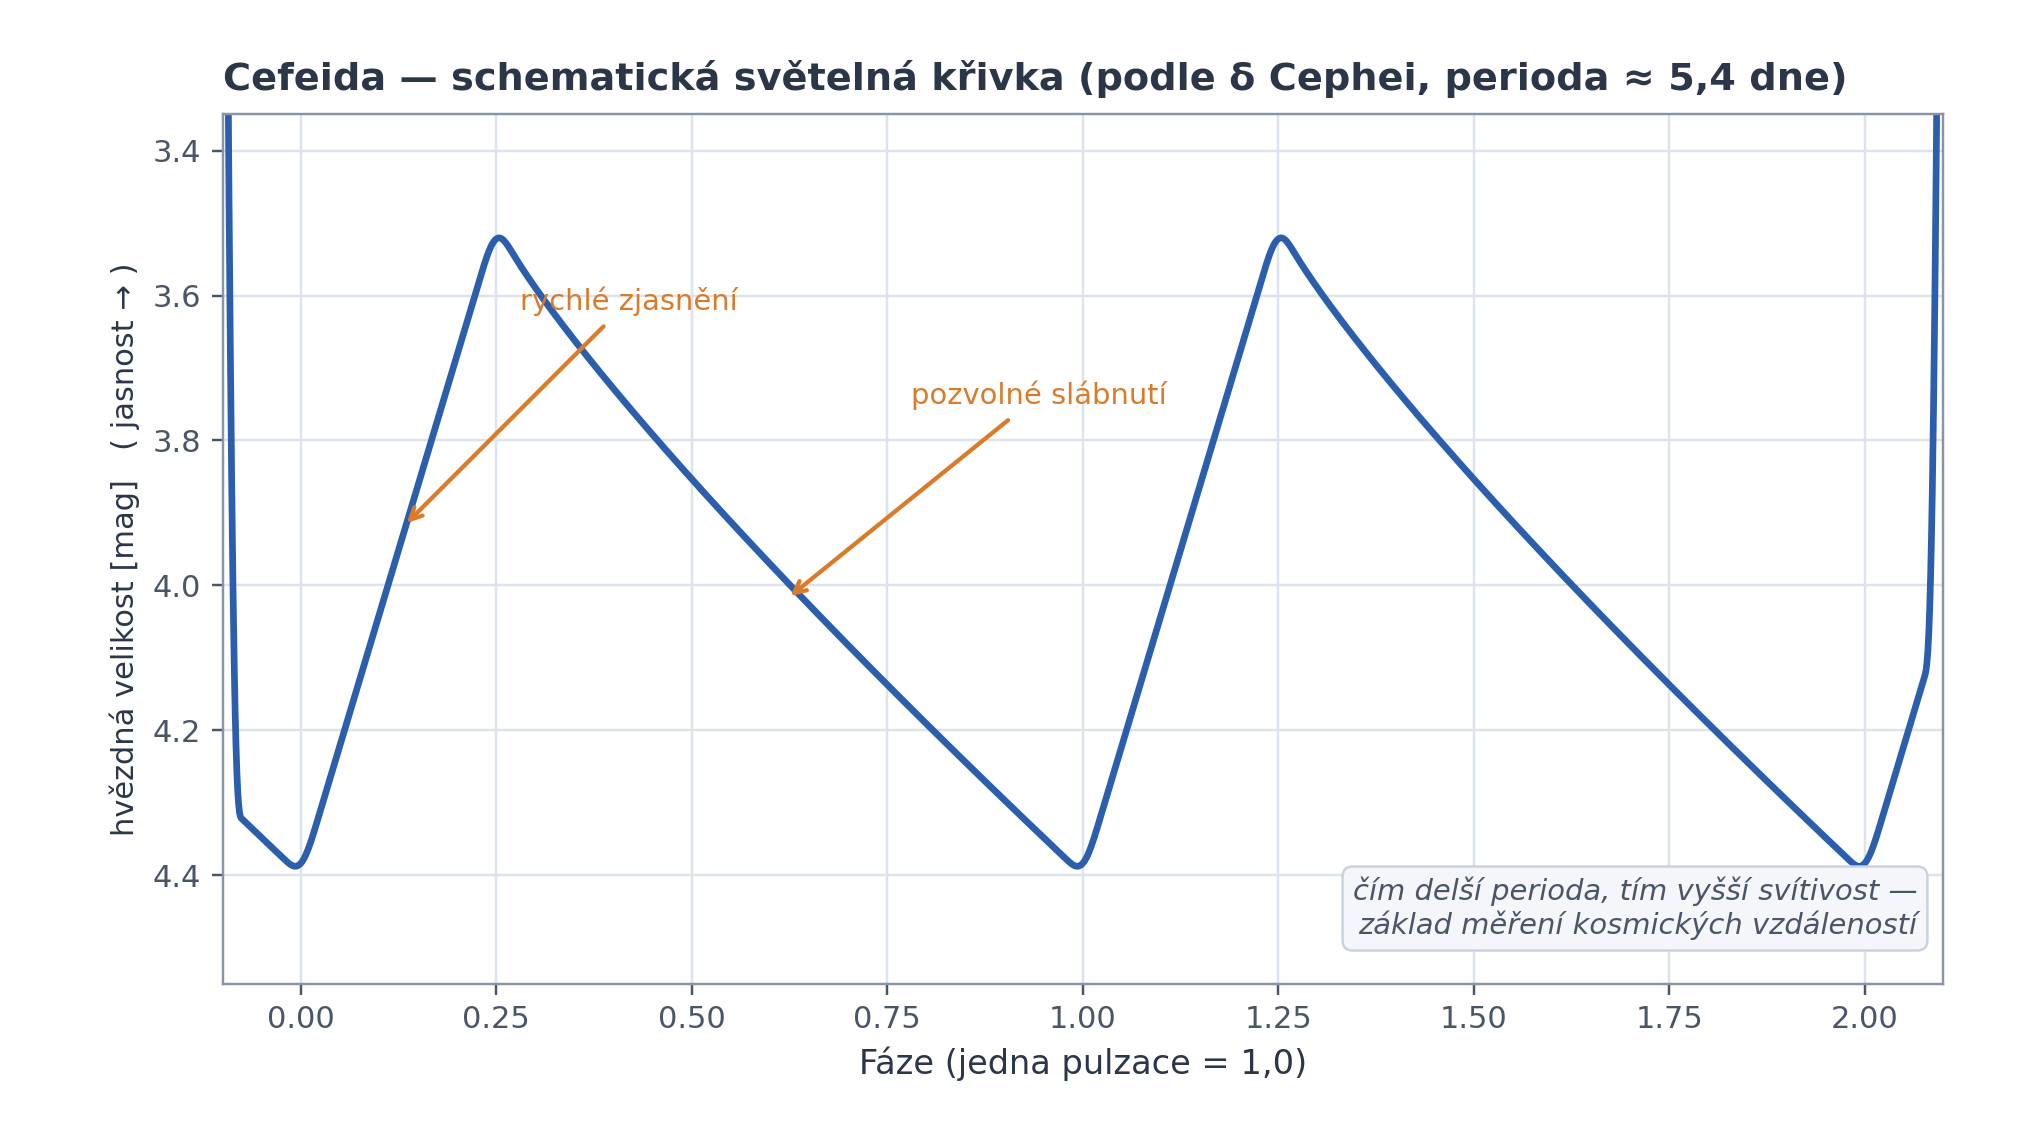
A typical Cepheid light curve—the shape is unmistakable: the star brightens rapidly, over about a quarter of the period, and then gradually fades. This is exactly what is happening: the star's atmosphere periodically expands and contracts. Here, a relationship applies that changed astronomy: the longer the period, the more luminous the star. Thus, one only needs to measure the period from such a curve, compare the actual luminosity with the observed brightness—and the distance is known. Schematic representation. Credit: SPHE ČAS, 2026.

Classification – Stars that Pulsate and Explode

The second large family consists of intrinsic variable stars—those where the star itself actually changes.

Pulsating variable stars change brightness through the periodic expansion and contraction of their atmospheres. This includes the aforementioned Cepheids, long-period pulsators, and the most important standard candles for determining cosmic distances. Furthermore, there are RR Lyrae stars—old, low-mass stars that serve astronomers in the study of globular clusters. And Delta Scuti stars, short-period pulsators typically of spectral classes A–F.

Explosive variable stars exhibit sudden and dramatic changes in brightness. Novae are caused by a thermonuclear explosion on the surface of a white dwarf that accretes matter from its stellar companion. Supernovae are the final collapse of a star—an event that often leaves behind a neutron star or a black hole. For novae and similar objects, the rapid response of amateurs is invaluable, as shown by our story of V838 Mon.

hltauri eso scaled | Variable Star Astronomy
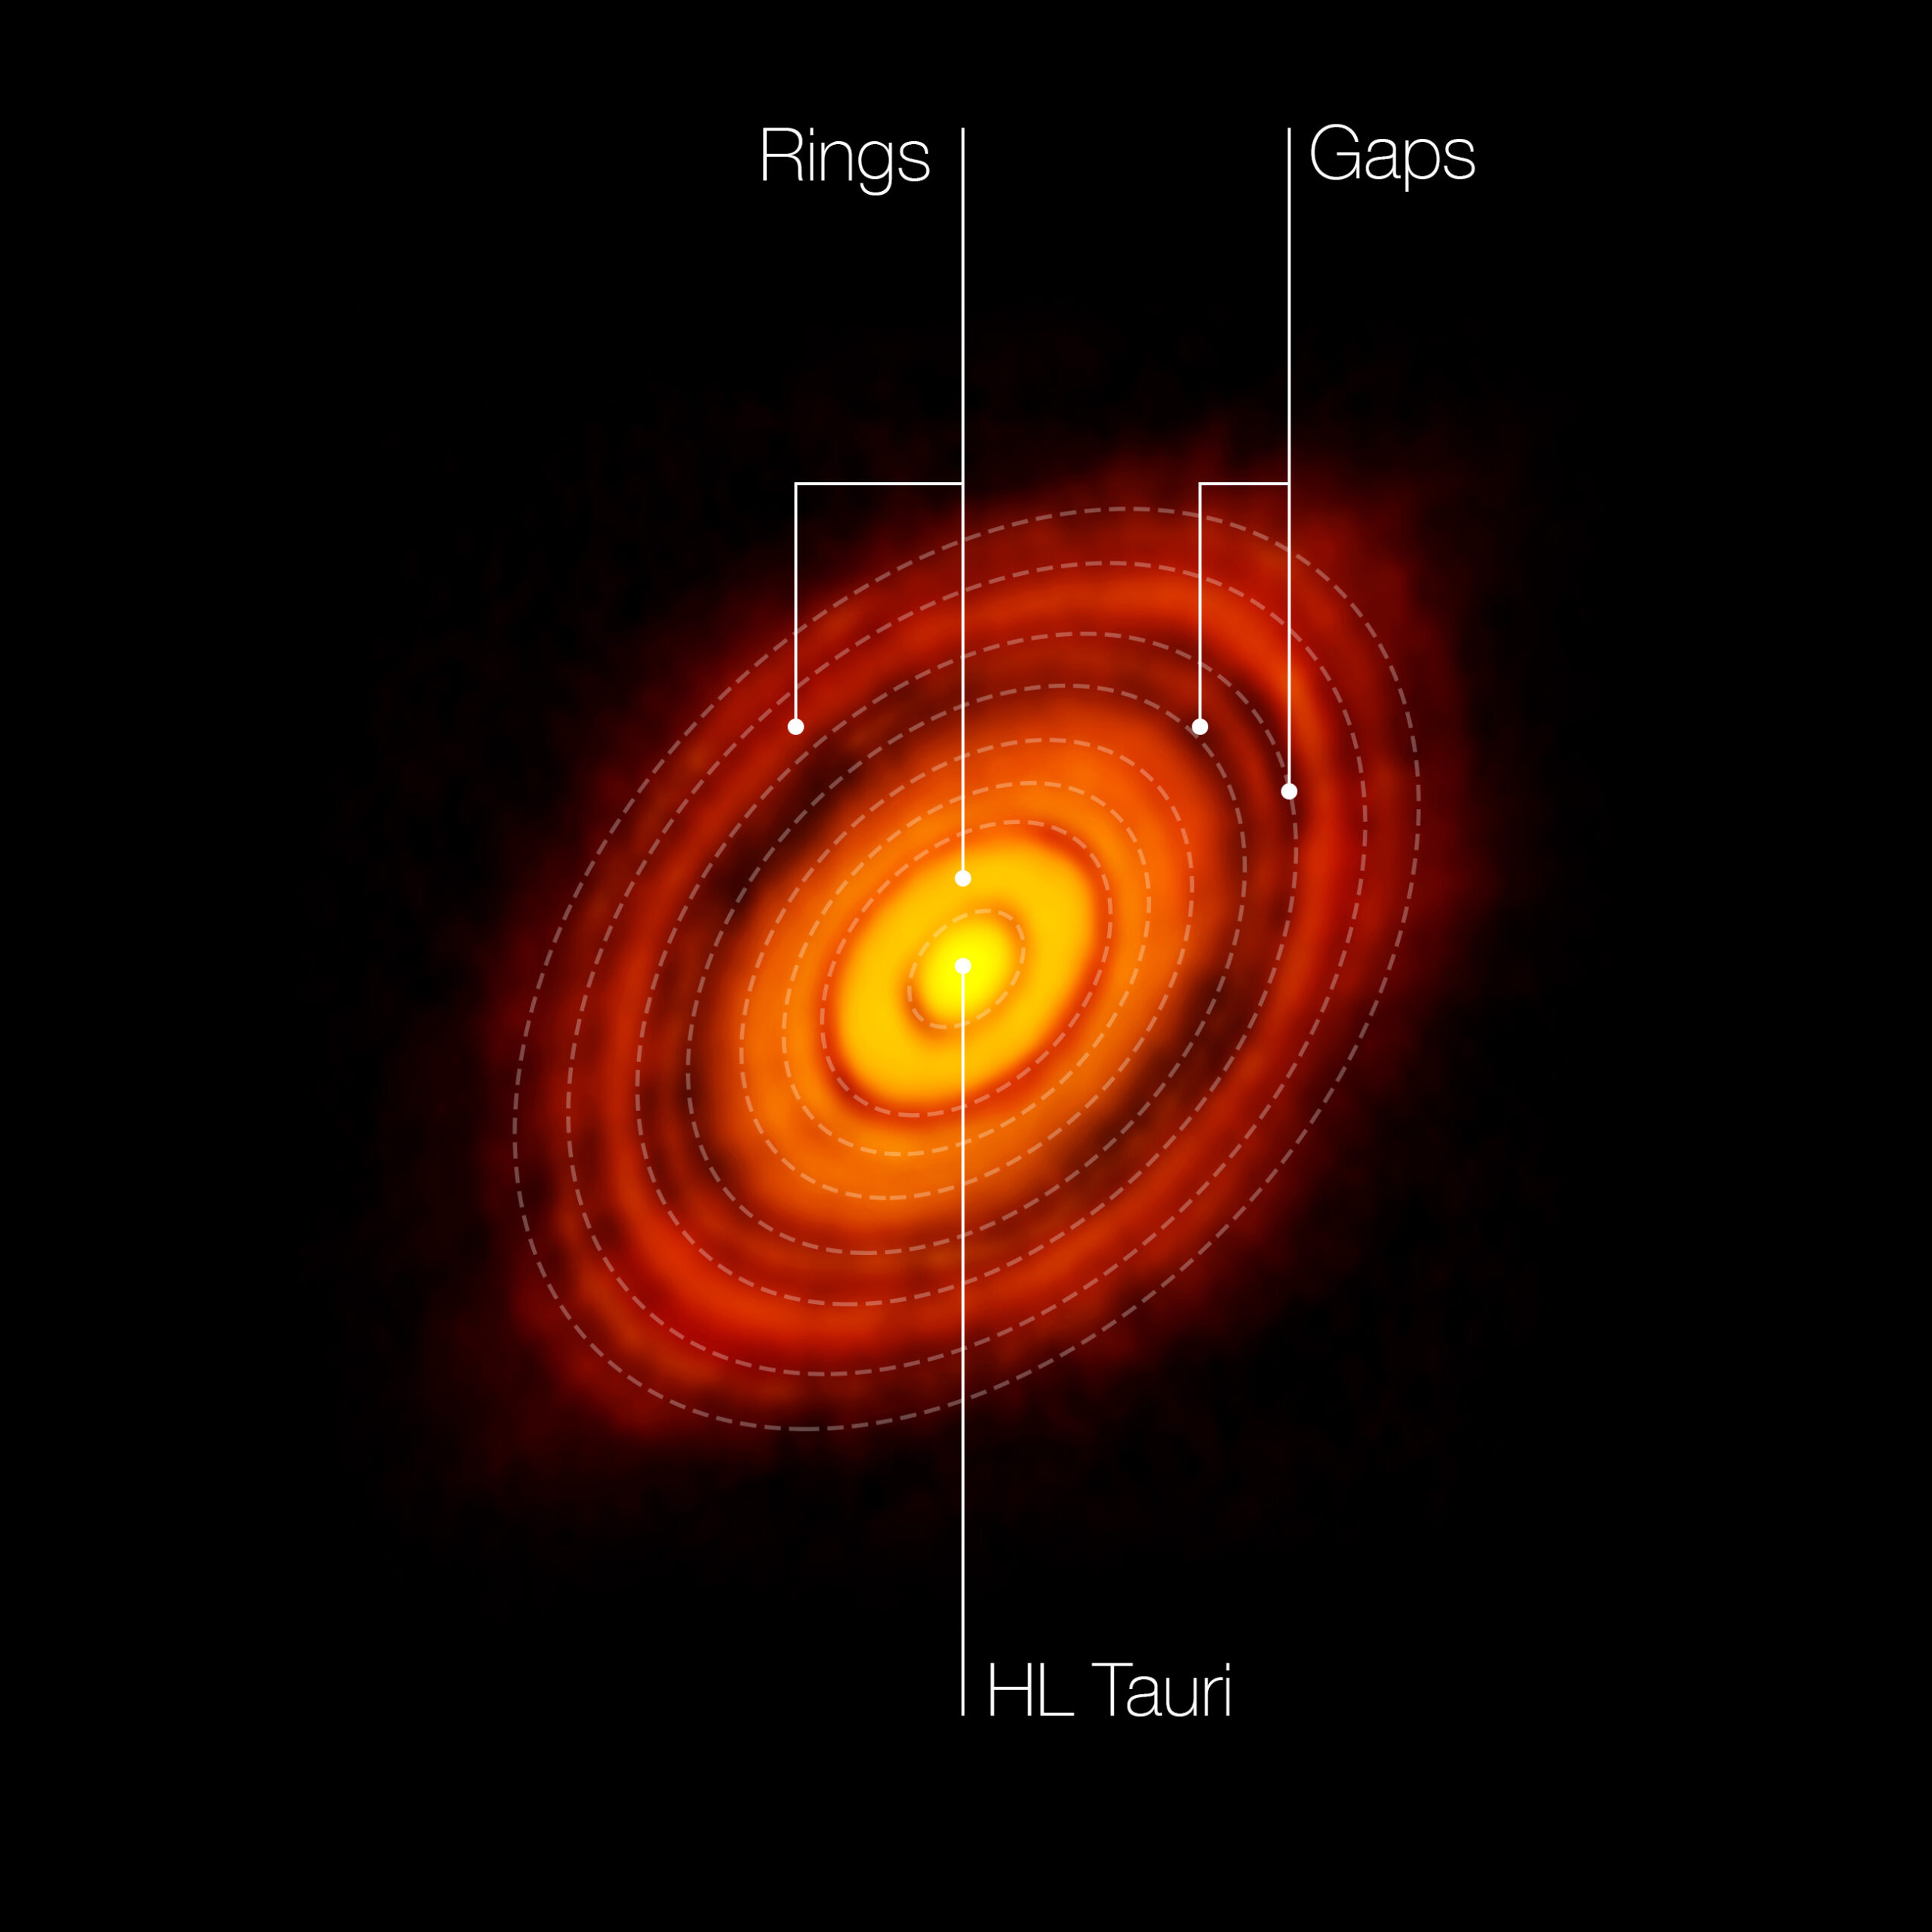
The star HL Tauri in the constellation Taurus, captured by the ALMA radio telescope. The young T Tauri-type star is surrounded by a protoplanetary disk—and the gaps between the rings reveal where forming planets are "clearing" their orbits. This 2014 image is among the sharpest views of a birthing planetary system ever captured by astronomy. Credit: ALMA (ESO/NAOJ/NRAO).

Classification – Special Types

The universe is too diverse to fit into just two categories. There are many variable stars that cannot be classified as classic pulsating or eclipsing variables.

Semi-regular and irregular variable stars are usually red giants or supergiants with unstable pulsations—their light curves are unpredictable and therefore all the more interesting for long-term monitoring. T Tauri stars, on the other hand, are stellar newborns: young stars with irregular brightness changes, often still surrounded by protoplanetary disks in which planets may be forming.

Be stars are rapidly rotating spectral class B stars that exhibit emission in hydrogen lines—they shed material into a gaseous disk around the equator. Chemically peculiar stars have unusual chemical compositions and often strong magnetic fields that drive their variability.

And at the most energetic end of the scale, we find high-energy sources: variable X-ray binaries or microquasars, where the accretion of matter onto a compact object—a neutron star or a black hole—creates radiation of immense energies.

o c diagramy tri tvary | Variable Star Astronomy
Three shapes, three stories. An O-C diagram plots the difference between the observed (O) and calculated (C) time of minimum for individual eclipses. A straight line of points means the period is correct; a parabola reveals a slow change in the period, perhaps due to mass transfer between components; and a wave-like pattern is usually the trace of a third body swinging the binary around a common center of mass. The same principle, now known as TTV, also reveals invisible exoplanets. Schematic representation. Credit: SPHE ČAS, 2026.

O-C Diagrams – When a Delay Tells a Story

Imagine a train that is supposed to run exactly according to a schedule. When it starts regularly running late, or conversely, running ahead of time, something is happening. One of the most powerful methods in variable star astronomy—the O-C diagram—is based on exactly this principle.

The abbreviation stands for Observed minus Calculated: we subtract the time calculated from the assumed period from the actually measured time of minimum brightness. The differences plotted in a graph create a pattern that tells the story of what is happening in the system. A straight horizontal line of points means the period is correct. Points forming a parabola reveal that the period is changing—perhaps because the binary components are transferring mass. And a wave? That often means a third, invisible body is orbiting the binary, causing it to wobble in space.

In modern literature, newer terms have also become established for the same concept. ETV (Eclipse Timing Variations) refers to variations in eclipse times in binary stars—essentially classic O-C analysis of minima. TTV (Transit Timing Variations) applies the same principle to exoplanets: when a planet’s transits in front of a star do not occur exactly on time, it may be due to the gravitational influence of another, as yet undiscovered planet in the system. It was through the TTV method that missions like Kepler discovered entire planetary systems—and it is a beautiful example of how a tool developed for variable stars also conquered exoplanet research. For our section, which has both in its name, it is a signature method.

And best of all: the long series of minima times, which O-C diagrams cannot do without, largely come from amateur observers. You can explore your own minima as well—in the O-C gateway at var.astro.cz.

Textbooks and Materials for Download

Over the decades, members of our section have written and lectured extensively on variable stars—from introductory texts for complete beginners to presentations from conferences and professional seminars. We are gradually converting these materials into electronic form and will publish them here for download as PDFs and presentations.

We are currently preparing the first textbooks for you—please excuse the empty shelf for now; it will soon begin to fill up. Until then, we recommend two proven sources: the var.astro.cz observation database with the O-C gateway and the international AAVSO (American Association of Variable Star Observers) with observation programs and manuals.

Links:

Work in progress 🚧