Observation

Variable stars and exoplanets are among the few areas of astronomy where even an observer with a backyard telescope can acquire data of genuine scientific value. While the pages Variable Star Astronomy and Exoplanets explain what and why we observe, this section focuses on the most practical aspects: how to do it—from selecting equipment and photometry to sourcing archival data. And once you know how, the Observing Programs will show you where to contribute your measurements.

obrazek1 | Observation
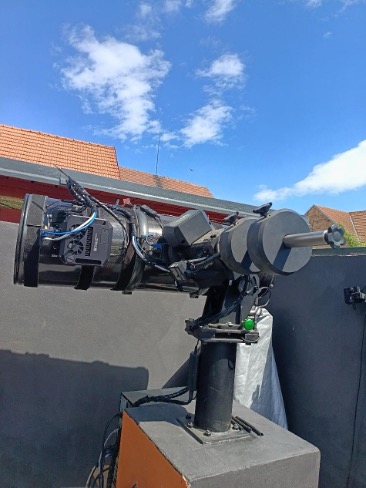
One of the larger remote-controlled amateur observation setups. It features a Newton-type telescope with a 305 mm mirror mounted on an EQ8 GOTO mount. It is equipped with a Moravian Instruments C3-26000 astronomical camera and a set of Sloan photometric filters. Credit: Zbyněk Henzl

Examples of observation equipment

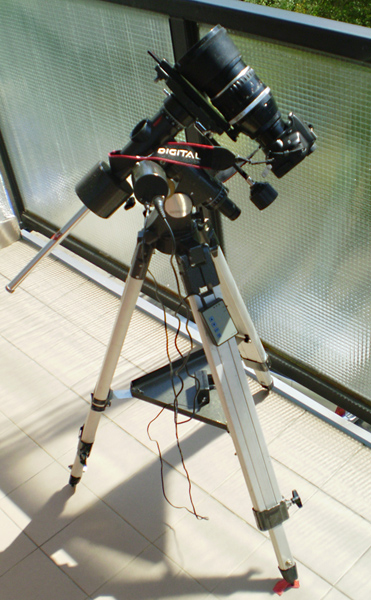
A wide range of instruments can be used to observe variable stars and exoplanet transits—from smaller astronomical telescopes to automated observatories (which are also accessible to amateurs). Reflecting or refracting telescopes equipped with a sensitive CCD or CMOS camera and a set of photometric filters are most commonly used. The optimal size of the primary mirror or objective lens ranges from 100–350 mm.

A high-quality mount with precise guiding and suitable software for observation control and subsequent image processing are also important. All these components are becoming increasingly accessible to amateur observers. A wide range of observation possibilities then offers an interesting scientific program for larger, sophisticated instruments as well as for small portable observation kits.

For many projects, the size of the telescope is not the decisive factor; rather, it is the precision, regularity, and duration of the observation series. Therefore, valuable data can be obtained by anyone who enjoys astronomy and is willing to perform careful measurements.

Currently, the attention of amateur astronomers is also shifting toward spectroscopy, and useful results can be achieved in this field as well. Working with a spectrograph typically requires a larger instrument, and the technical demands are somewhat higher.

More detailed information regarding the section’s optics, detectors, and observatories can be found in the following materials.

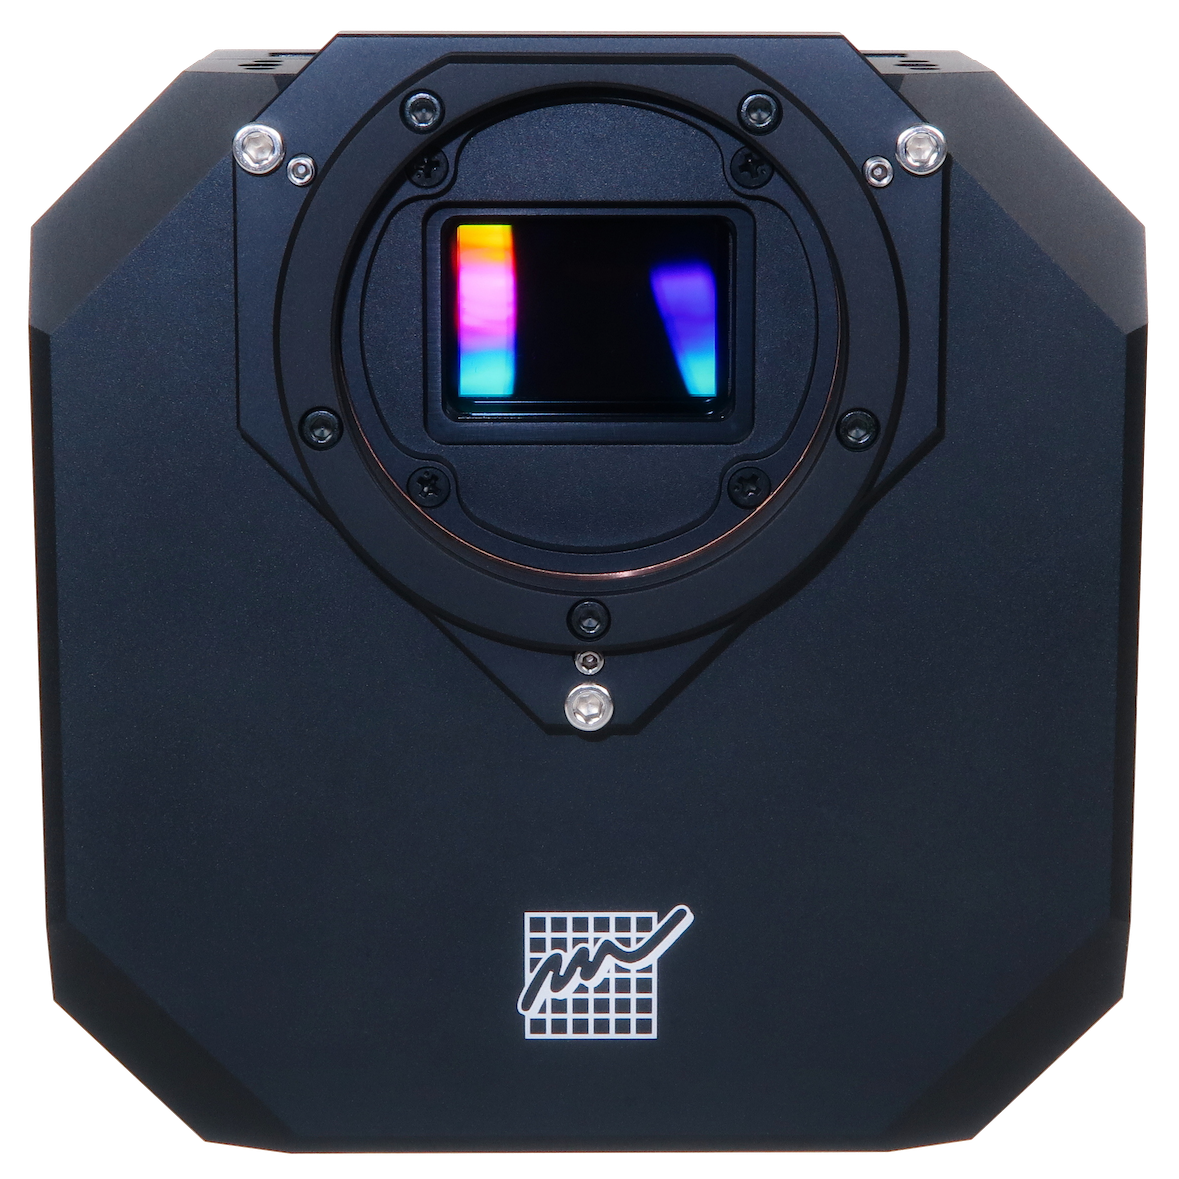
c3 61000 flash1 | Observation
CCD and CMOS sensors convert starlight into digital data, which can be used to determine brightness changes in variable stars and exoplanet transits. Credit: Moravian Instruments

Astronomical detectors

The heart of modern astronomical observation is the sensitive electronic detector. Today, amateur astronomers primarily use cooled CCD and CMOS cameras, which convert incoming light into a digital image. Each pixel of the sensor records the amount of light received, allowing for the precise measurement of stellar brightness and even the very small dips caused by an exoplanet transit.

CCD cameras were the standard for precise astronomical photometry for a long time. Currently, they are increasingly being replaced by modern CMOS sensors, which offer low readout noise, fast image reading, and high sensitivity. For precise measurements, chip cooling is also important to limit thermal noise, as is the correct calibration of images using dark, flat, and bias frames.

High-quality photometric data can be obtained even with a commonly available amateur camera. More important than the type of detector itself is its correct configuration, stable operation, and the careful processing of the measured data.

The choice of photometric filters is equally important. Measuring within standardized systems (most commonly Johnson-Cousins or Sloan) ensures that your data is comparable with measurements from other observers and usable in shared databases and publications.

obrazek5 | Observation
The light curve of the eclipsing variable star CzeV1000 created from photometric measurements. Significant drops in brightness occur during the mutual eclipses of the binary star components. Credit: Zbyněk Henzl

Photometry

Photometry is a method for the precise measurement of the brightness of astronomical objects. When observing variable stars and exoplanets, the brightness of a selected target star is usually monitored over time and compared with several stable stars in the same field of view. This helps to mitigate the effects of varying atmospheric transparency, the object’s altitude above the horizon, and other observing conditions.

The result of the measurement is a light curve that captures the changes in the object’s brightness. Its shape can reveal the eclipse of binary star components, stellar pulsations, eruptive activity, or the slight dip in brightness during an exoplanet’s transit in front of a star. Although individual stars on an image are often only a few pixels wide, careful calibration and processing allow for the measurement of brightness changes on the order of thousandths of a magnitude.

For high-quality photometry, the correct choice of exposure, suitable comparison stars, a stable observation setup, and image calibration using dark and flat frames are essential.

Specialized photometric software is used to process images and obtain a light curve. We recommend the freely downloadable SIPS program, which is not tied to a specific camera and is widely used among observers; Muniwin is also popular.

Completed light curves are uploaded to the VarAstro database [prolink], where they can be further processed, compared with other measurements, and integrated into the section’s scientific projects.

For the sake of completeness: the astronomical magnitude scale is inverted—the brighter the star, the smaller the number. Therefore, in light curves, the vertical axis is usually inverted so that brighter points are positioned at the top.

obrazek6 | Observation
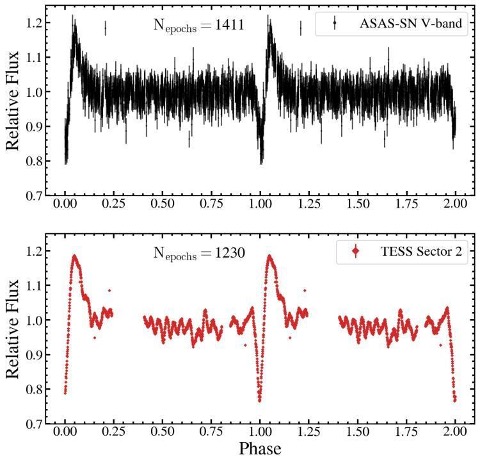
Comparison of light curves of the same variable star from the ground-based ASAS-SN survey and the TESS space observatory. By combining different data sources, a more detailed and long-term picture of its variability can be obtained. Credit: Zbyněk Henzl

Survey data and how to use it

Modern astronomical surveys regularly image large portions of the sky and create light curves for millions of stars. Observers can thus utilize extensive, publicly available measurements without having to acquire all the data with their own telescope.

The TESS space observatory provides highly precise measurements with dense temporal coverage, which are suitable for searching for exoplanet transits, eclipsing binaries, pulsations, and other short-term brightness changes. Ready-made light curves, target pixel files of individual stars, and full-frame images are available.

Ground-based surveys, such as ASAS-SN, ZTF, and others, have been monitoring the sky repeatedly for many years. Their data is therefore particularly valuable for studying long-term changes, eruptive stars, novae, supernovae, or for refining the periods of variable stars. ASAS-SN generates light curves of objects from a global network of small robotic telescopes.

Furthermore, the Gaia astrometric mission has published a catalog of hundreds of thousands of variable stars, which is useful for their identification and classification.

Survey data can be used, for example, to:

  • search for previously unknown variable stars,
  • determine and refine their periods,
  • construct light curves spanning many years,
  • plan your own observations,
  • compare your own measurements with independent data,
  • capture changes that occurred even before your own observations began.

The greatest value often comes from the combination of survey and personal observations. A survey provides a long or very dense series of measurements, while an amateur observer can specifically fill in missing periods, use different filters, or monitor an object during an important eclipse or outburst.
Manuals and guides for download

Practical guides that walk you through the entire process from image acquisition to data submission will be available for download here.

🚧

Now you know how to observe variable stars and exoplanets—from choosing a telescope to creating a precise light curve. All that remains is the best part: getting involved.

  • Want to know what to observe and where to send the data? Check out our Observing Programs.
  • Do you have questions and want to discuss them with someone? Contact us.
  • Would you like to take your first measurements using the Section’s telescope? Join us.